Population effects of increase in world energy
use and CO2 emissions: 1990-2019
First online: 3 December 2020
Aalok
Ranjan Chaurasia
MLC
Foundation and ‘Shyam’ Institute, Bhopal, MP, India
–––––––––––––––––––––––––––––––––––––––––––
DOI: 10.3197/jps.2020.5.1.87
Licensing: This article is Open Access (CC BY 4.0).
How to Cite:
Chaurasia, A.R. 2016. 'Population effects of increase in world energy use and CO2 emissions: 1990–2019'. The Journal of Population and Sustainability 5(1): 87–125.
https://doi.org/10.3197/jps.2020.5.1.87
–––––––––––––––––––––––––––––––––––––––––––
Abstract
This paper analyses population effects of increase in world energy
use and CO2 emissions between 1990-2019
following a decomposition framework with interaction effects. The analysis
has also been carried out for the 44 countries which accounted for most of the
increase in world energy use and CO2 emissions during
1990-2019. Population growth was found to have a significant effect on
both the increase in energy use and CO2 emissions at the global level,
although the contribution of population growth to these increases has varied
widely across countries. There is a need for integrating population factors in
the sustainable development processes, particularly efforts directed towards
environmental sustainability.
Keywords:
population; energy use; global CO2 emissions.
Introduction
The
impact of human activity on the environment can be conceptualised in terms of
the use of natural resources and resulting wastes generated. The environment
provides natural resources necessary for human activity. It also serves as the
repository of wastes generated as a result of natural resource use. The quantum
of natural resource use is determined by the extensiveness and intensity of
natural resource use while the extent of wastes generated is determined by the
efficiency of natural resource use, in addition to the extensiveness and
intensity of natural resource use. The relationship between extensiveness,
intensity and efficiency in deciding the quantum of natural resource use and
extent of wastes generated is multiplicative, not additive. Implications of
human activity on the environment, therefore, should be analysed in terms of
extensiveness, intensity and efficiency of natural resource use. Such an
analysis requires quantifying natural resource use and measuring its
extensiveness, intensity and efficiency. Extensiveness of natural
resource use can be measured in terms of the number of human beings or
population size. Other things being equal, the larger the population the more
the natural resource use. Intensity, on the other hand, can be measured in
terms of per capita natural resource consumption. Finally, efficiency can be
measured in terms of wastes generated per unit of natural resources used.
Population, in this conceptualization, is an integral component of any analysis
of the environmental impact of human activity. However, there is a conspicuous
silence in recent years about the role of population in the debate on
environmental sustainability. For example, the United Nations 2030 Agenda for
Sustainable Development pays only a passing attention to population related
issues and concerns in the quest to secure environmental sustainability (United
Nations, 2015). Kopnina and Washington (2016) have discussed at length why
population growth has been ignored in setting priorities for environmental sustainability.
They conclude that without giving due attention to the population dimension of
environmental sustainability, the probability of securing an ecologically
sustainable future will be vanishingly small.
Concern
about the implications of size and growth of population on the use of natural
resources is not new and dates back to time immemorial. In ancient times,
Chinese philosophers attempted to formulate an ideal proportion between land
and population to ensure survival of mankind and for the development and
well-being of society. The question of ‘optimum population’ in the context of
ideal conditions for the development of the full potential of an individual was
also discussed by Greek Philosophers Plato and Aristotle. Similar echoes may
also be found in Arthashastra written by Kautilya in
India (United Nations, 1973). During the Medieval period, availability of
natural resources necessary for sustaining life was argued to be a key factor
in population growth (Batero, 1589). The view prevalent at that time was that
‘resources’ determined population’. More than two centuries later, Malthus was
the first to argue that misery and vice would result from the differential pace
of growth between population and the productivity of agriculture necessary to support
it (Malthus, 1960 [1798]). In the 1940s the concern about population growth
shifted to natural resources, particularly energy supplies, whereas in 1950s,
especially in the less developed countries, this concern revolved round
physical capital (Preston, 1994). The negative effects of population growth on
the environment have also been highlighted in a number of studies carried out
in 1960s and 1970s (Ehrlich, 1968; Forrester, 1971; Meadows et al, 1972). In
recent years, concern about the environmental impact of population growth has
focused on the wastes generated as a result of natural resource use. It is
argued that excessive use of natural resources is causing irreparable damage to
the environment with emissions of greenhouse gasses such as carbon dioxide (CO2) being the most glaring example of the
irrational use of natural resources (Chaurasia [Ranjan], 2009).
Ehrlich
(1968) was the first to propose a simple analytical framework, known as IPAT (Impact = Population x Affluence x Technology) framework, for an ex post analysis
of the environmental impact of human activity. This framework describes how
natural resource use can be explained in terms of extensiveness (population
size), intensity (per capita natural resource use)
and efficiency (wastes generated per unit of
natural resource use). This simple yet straightforward analytical
framework has been criticized for a number of perceived flaws (O’Neil and Chen,
2002), but it has almost become the norm in analysing population effects of the
environment. The framework illustrates the multiplicative nature of
relationship among driving factors of natural resource use as each factor
amplifies changes in other factors. A small change in population induces a
small absolute impact on natural resources use in a country with low-income and
low intensity of natural resources use but much greater effect in a high-income
country where intensity of natural resources use is high (O’Neil and Chen,
2002).
There
have been efforts to improve the simple IPAT framework.
Notable among these efforts is the stochastic version of the framework known as
STIRPAT framework (Dietz and Rosa, 1994; Dietz, Rosa and York, 2007; Chertow,
2001). Another framework is the ImPACT framework which divides the affluence
component of the IPAT framework into two components separating
energy use per capita from income per capita (Waggoner and Ausubel, 2002). In
this framework, which is based on the Kaya identity (Kaya, 1990), population,
per capita income, natural resource use per capita and waste generated per unit
of natural resource use determine the impact of human activity on the
environment. I have previously used this framework to analyse the change in
natural resource use and waste generated in the world during 1990-2000 and
found that although the main driver of the environmental impact of human
activity was the increase in per capita income or affluence, the effect of
population growth on the environment was quite substantial. The debate about
the environmental impact of population growth, however, remains inconclusive.
Different perspectives on the effect of population size on the environment have
been discussed by Weber and Sciubba (2019) who have argued that one reason for
the prevailing inconclusiveness is the approach of these analyses. Most of the
population-environment impact analyses are based on cross-country data which
suffer from high level of dissimilarity and strong collinearity among factors
that influence both increase in natural resource use and resulting wastes
generated. Onanuga (2017) has analysed population elasticity of CO2 emissions
in 26 African countries on the basis of time series data for the period
1971-2013 and observed that the response of emissions to population growth has
a limiting effect in some countries but a contributory effect in others. Shi
(2003) found a direct relationship between population change and CO2 emissions
in 93 countries during 1975-1996. A similar result has also been obtained by
Cole and Neumayer (2004).
In
this paper, I carry out an ex post analysis of the contribution of
population change to the change in energy use and CO2 emissions
in the world and in its 44 countries during 1990-2019. The 44 countries
included in the present analysis account for nearly all the increase in world
energy use and CO2 emissions. The paper also carries out
country-specific analyses to highlight population effect of the environment as
reflected through the increase in energy use and CO2 emissions.
The paper separates the direct effect of population change from its indirect
effect that works through the change in the intensity and efficiency of natural
resources use. The findings of the analysis emphasise the need for population
factors to be integrated in efforts directed towards securing environmental
sustainability.
The
paper is organised as follows. The next section of the paper outlines the methodology.
I use a decomposition framework with interaction effects to estimate the
contribution of organized population change to the change in energy use and CO2 emissions.
Section three describes the data source. The analysis is based on the data made
available by EnerData, an independent research and consulting firm. Section
four presents a snapshot of the trend in energy use and CO2 emissions
along with the trend in population, consumption and technology. Results of the
decomposition analysis are presented in section five. The last section
discusses policy implications in the context of sustainable development.
Analytical Framework
Let E denote
the total energy use and P denote population size. Then, total
energy use may be written as at product of population size and per capita
energy use

It is
well-known that there is a linear relationship between per capita income and
per capita energy use (Cole et al, 1997; Suri and Chapman, 1998). If G denotes
the real gross domestic product (GDP), then equation (1) may be extended as

where A=G/P is the per capita real GDP which is a
commonly used indicator of per capita income and the ratio U=(E/P)/(G/P)=(E/G)
is the ratio of per capita energy use to per capita real GDP. It is known as
the energy intensity of GDP.
Extending
the above arguments further, total CO2 emissions,
as a result of energy use may be written as

where T=(C/P)/(E/P)=(C/E)
is CO2 emissions per unit energy use and is
termed as carbon intensity of energy use. The change in energy use and CO2 emissions between two points in time t2 >t1, can be captured in relative terms and in
absolute terms. In relative terms, the change in energy use and CO2 emissions can be written as


Equations
(4) and (5) may also be written as
![]()

where aE=ln(rE), etc.
Equations (6) and (7) are true by definition which means that naive regression
or correlation approaches, that ignore the sum constraint, are potentially
problematic in explaining how inter-country variation in aP, aA, and aU influences inter-country variation in aU and inter-country variation in aP, aA, aU, and aT influences inter-country
variation in aC. To overcome this problem, Preston
(1996) has suggested to decompose the inter-country variation in aE or aC in terms of inter-country variation in aP, aA, aU and aT. The
inter-country variance in aE can
be decomposed as
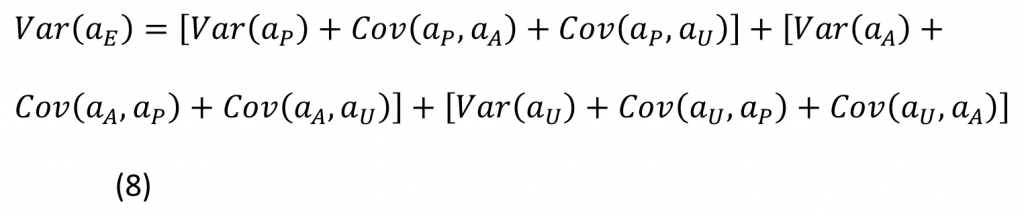
where Var denotes
the variance and Cov denotes the covariance. The contribution
of the change in population to the change in energy use may now be measured in
terms of the proportion of the inter-country variance in aE explained by the inter-country variance
in aP:

Similarly,
the inter-country variance in aC can
be decomposed as:
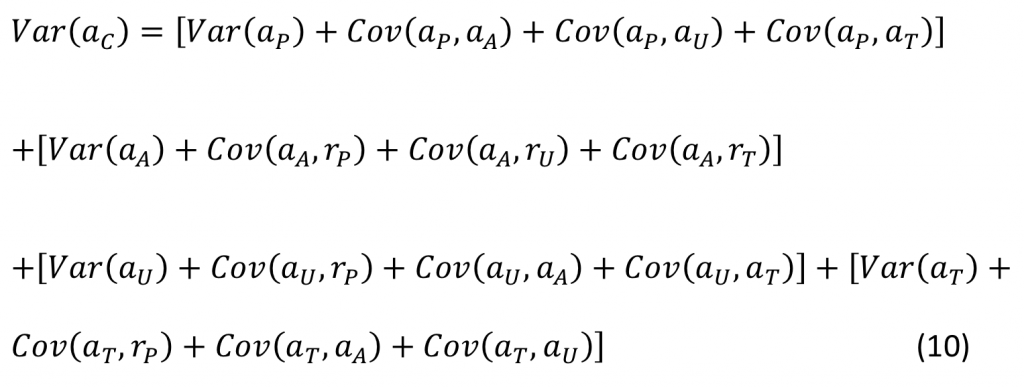
and
the inter-country variance in aC attributed
to the inter-country variance in aP to
the inter-country variance in aC may
be obtained as
It
may be noted that the contribution of inter-country variance in aP to the inter-country variance in aE or aC may be small for two reasons. First, the
contribution of inter-country variance in aP to the inter-country variance in aE or aC may be small because aP varies little across countries so that
the corresponding variance and covariance terms in equation (8) and (10) are
small. Second, even if aP varies
substantially across countries, the contribution of inter-country variance in aP to the inter-country variance in aE or aC may still be small because covariance
terms in equations (8) and (10) are negative so that the algebraic sum of
variance and covariance terms is small. In this case, equations (9) and (11)
may not reflect the true importance of inter-country variance in aP in explaining the inter-country variance
in aE or aC. To
circumvent this problem, it is suggested to use absolute values of covariance
in equations (9) and (11) (Horvitz et al, 1997; Rees et al, 2010: Rees et al,
1996). In other words, the importance of the inter-country variance in aP to the inter-country variance in aE can then be obtained as
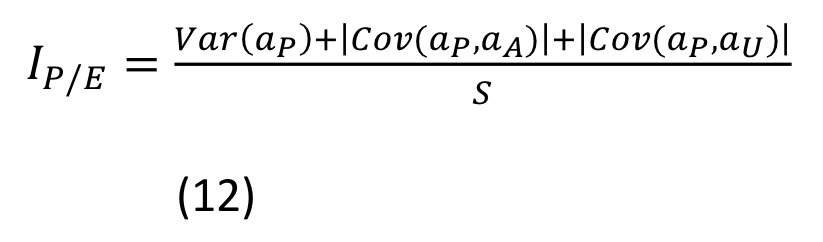
where S is
the sum of the absolute values of the terms on the right-hand side of equation
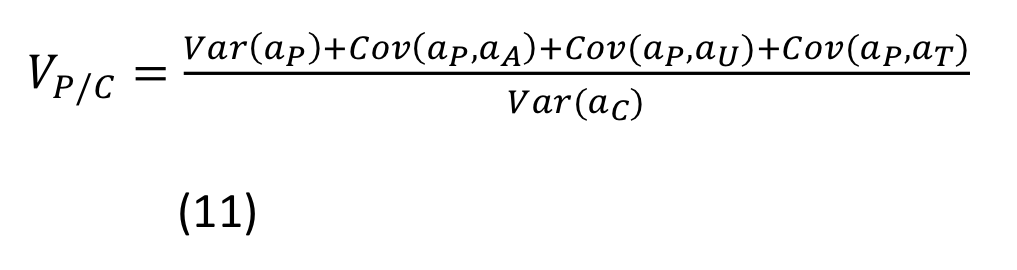
(8). Similarly, the relative importance of the inter-country variance in aP to inter-country variance in aC may then be obtained as

where V is
the sum of the absolute values of the terms on the right-hand side of equations
(11).
On
the other hand, the absolute change in the energy use between two points in
time t2>t1 can
be decomposed as:
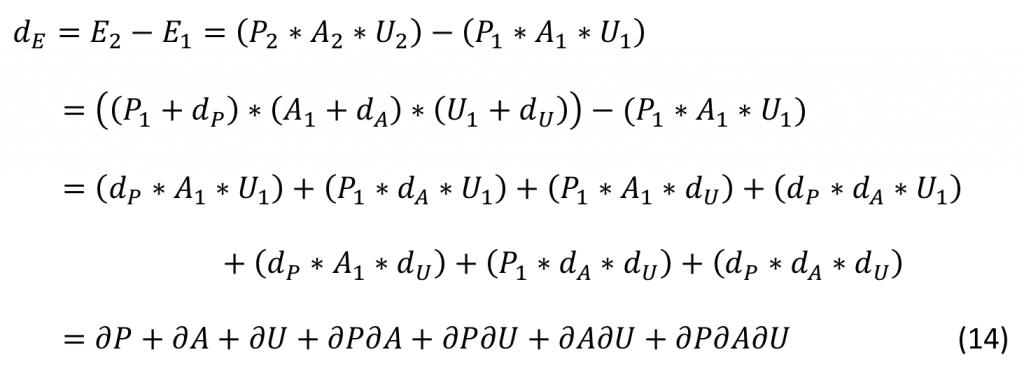
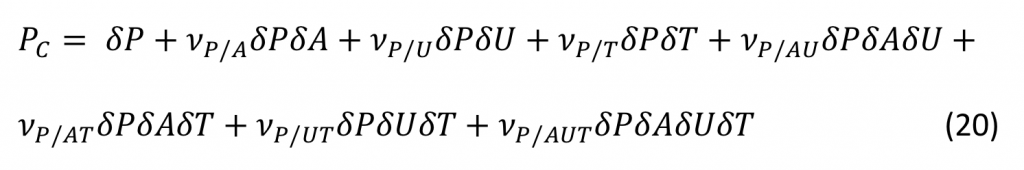
where
The first three terms on the right-hand side of equation (14) reflect the
main effects, the next three terms reflect the first order or two-way
interactions while the last term reflects the second order or three-way
interaction among population, per capita real GDP and energy intensity of GDP.
The advantage of the decomposition given by equation (14) is that it shows both
direct and indirect effects of the change in population, per capita real GDP
and energy intensity of GDP as they affect the change in the energy use.
Although, interaction effects are difficult to interpret (Preston, Heuveline,
Guillot, 2001), yet they provide useful insights into how population growth
(increase in extensiveness of natural resources use) interacts with the change
in per capita real GDP and the change in the energy intensity of GDP in
influencing the change in natural resource use. The change in per capita GDP
and the change in the energy intensity of GDP, in combination, determine the
intensity of natural resource use.
Similarly,
change in CO2 emissions can be decomposed as
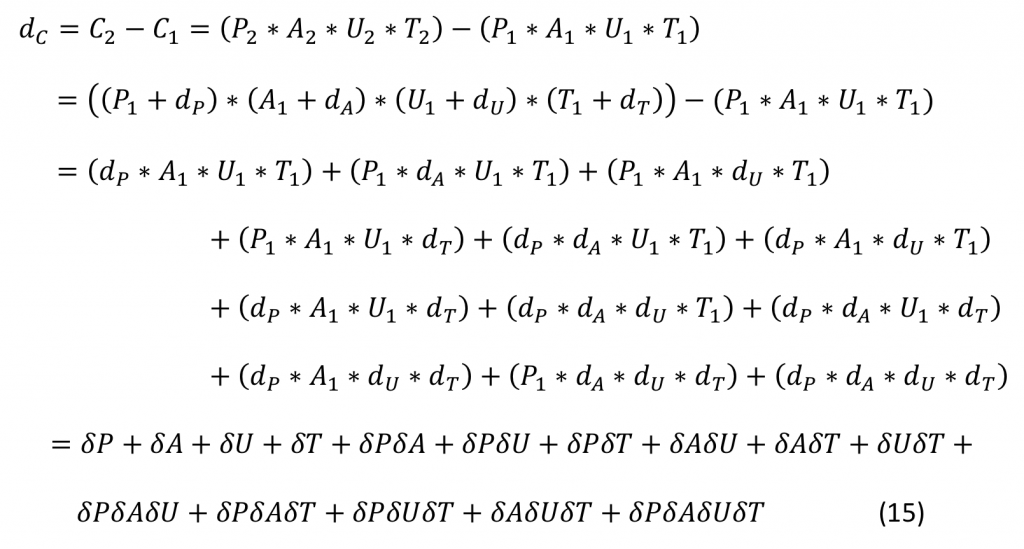
In
order to estimate total effect of population change on the change in energy use
and CO2 emissions, it is necessary to distribute
the interaction effect across interacting factors. Kim and Strobino (1984) have
applied Goldfield’s rule (Durand, 1948, p.220) of “allocating interactions to
different individual factors on the principle of equal distribution of all
factors involved in each interaction” to allocate interaction effects to
individual factors. In contrast, I have previously applied principal component
analysis to determine relative weights of factors involved in interaction term
(Chaurasia, 2017). Alternatively, weights may also be determined on the basis
of the relative increase in factors involved in different interaction terms.
For example, weight for the change in population in the interaction term ∂P∂A in equation (14) may be estimated as
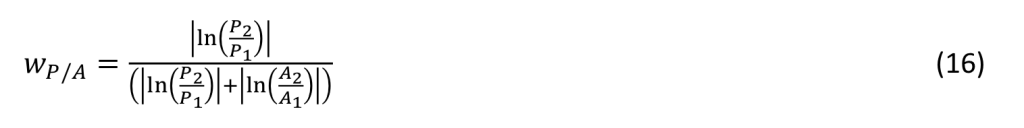
weights
for other factors involved in different interaction terms may also be obtained
in a similar manner.
The
change in energy use and CO2 emissions
between two points in time t2>t1 may
also be decomposed as

and

The
decomposition given by equations (17) and (18) is known as logarithmic mean
Divisia index (LMDI) factor decomposition. It is one of the index decomposition
analysis (IDA) approaches widely used in energy and environmental economics
(Chen et al, 2020; Hammond and Norman, 2012; Kumbaroglu, 2011). This
decomposition was proposed by Ang and Liu (2001) and further developed by Ang
(2004; 2005; 2015). Bacon and Bhattacharya (2007) have applied this approach to
analyse the impact of growth on CO2 emissions
during 1994-2004 in 70 countries of the world. The decomposition given by
equations (17) and (18), however, provides little insight into direct and
indirect effects of change in factors of energy use and CO2 emissions. In fact, decomposition given
by equations (17) and (18) is actually an arithmetic manipulation of equations
(6) and (7). Like equations (6) and (7), equations (17) and (18) also treat
different factors as independent of each other when analysing the change in
energy use and CO2 emissions.
Based
on equation (14), the population effect of the change in energy use can be
estimated as
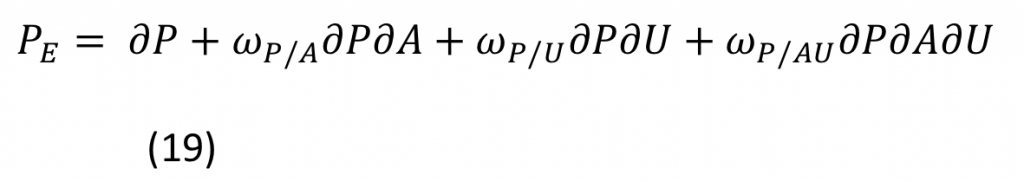
Similarly,
the population effect of the change in CO2 emissions
can be estimated as
Data Source
The
analysis is based on estimates of total energy use, CO2 emissions
and energy intensity of GDP for the world and for 44 countries for the period
1990-2019 prepared by Enerdata, an independent information and consultancy firm
(Enerdata, 2020). In addition, estimates of population prepared by the United
Nations Population Division (United Nations, 2019) have been used in the
present analysis. The energy use has been defined as the balance of the
primary energy production, external energy trade, marine bunkers and stock
changes including biomass. Estimates of energy use for the world include marine
bunkers also but they are not included while estimating energy use in different
countries (Enerdata, 2020).
On
the other hand, estimates of CO2 emissions
are confined to emissions from fossil fuel combustion (coal, oil and gas) only.
They have been estimated following the methodology proposed by the United
Nations Framework Convention for Climate Change (UNFCCC, 2009). Moreover, the
energy efficiency of GDP has been calculated as the ratio of total energy use
to real GDP which has been measured in terms of 2015 US$ purchasing power
parity while carbon intensity of energy use is measured as CO2emissions per
unit energy use. The 44 countries that have been included in the present
analysis accounted for more than 86 percent of the world energy use, almost 92
percent of the world CO2 emissions
and around 72 per cent of the world population in 2019. Collectively, they
primarily determine the level and trend in world energy use and CO2 emissions.
Global Trend in Energy Use and
CO2 Emissions
Total
energy use in the world increased by more than 64 percent during 1990-2019,
from 8756 million of tonnes of oil equivalent (Mtoe) in 1990 to 14378 Mtoe in
2019 whereas CO2 emissions
increased by more than 61 percent, from 20311 miillion tonnes (Mt) in 1990 to
32741 Mt in 2019. The world population increased by almost 45 percent during
this period, from 5.327 billion to 7.713 billion, per capita real GDP at 2015
US$ purchasing power parity increased by almost 80 percent, from 9440 to 16982,
energy intensity of GDP decreased by almost 37 percent, from 0.174 to 0.110 and
carbon intensity of energy use decreased by less than 2 percent, from 2.320 to
2.277 between 1990 and 2019 (appendix table 1). The trend in energy use and CO2 emissions and factors that determine them
has, however, not been linear but changed frequently as revealed through
“joinpoint” regression analysis (Kim et al, 2000) which studies the variation
in trends over time. It identifies the time point(s), or joinpoint(s), at which
the trend in the variable of interest changes and then estimates the trend
between two joinpoint(s) in terms of annual percent change. The Joinpoint
Trend Analysis software developed by National Cancer Institute of United States
of America (NCI, 2013) has been used for carrying out the joinpoint regression
analysis.
Application
of joinpoint regression analysis reveals that the trend in world energy use
changed three times during 1990-2019 (appendix table 2). The annual percent
change in the world energy use was 1.401 percent during 1990-2001 but increased
to 3.289 percent during 2001-2006. After 2006, the annual percent change
decreased to 1.877 percent during 2006-2012 and to 1.184 percent during
2012-19. On the other hand, the trend in global CO2 emissions
changed four times. The annual percent change in global CO2 emissions was just 0.120 percent during
1990-1992 but increased to 1.579 percent during 1993-2002 and to 4.396 percent
during 2002-05. After 2005, the annual percent change in CO2 emissions decreased to 2.219 percent
during 2005-2012 and to only 0.683 percent during 2012-2019. Similarly,
the trend in all the factors of energy use and CO2 emissions
also changed frequently. The trend in population changed five times; the trend
in real per capita GDP changed three times; the trend in energy intensity of
GDP changed five times; and the trend in carbon intensity of energy use changed
two times. The annual percentage change in population decreased in every time
period whereas the annual percentage change in real per capita GDP was the
highest during 2003-2006. The decrease in energy intensity of GDP, as reflected
in annual percentage change, was very rapid during 2004-2007 and again during
2010-2019. Finally, the carbon intensity of energy use increased during
1999-2013 but decreased quite rapidly thereafter.
The
change in both energy use and CO2 emissions
varied widely across the 44 countries included in the present analysis
(appendix able 3). The energy use and CO2 emissions
did not increase in all countries included in the present analysis. There are
11 countries where energy use decreased and 13 countries where CO2 emissions decreased during
the period under reference. The decrease in both energy use and CO2 emissions has been the most rapid in
Ukraine while the increase in both energy use and CO2emissions has been the most rapid in Malaysia. Among
factors of energy use and CO2 emissions,
population increased in all but four countries – Poland, Romania, Russia and
Ukraine – whereas per capita real GDP increased in all but three countries –
Ukraine, Venezuela and United Arab Emirates. By comparison, energy intensity of
GDP decreased in 36 countries while carbon intensity of energy use decreased in
30 countries.
More
than two thirds of the global increase in energy use during 1990-2019 has been
confined to only five countries – China, India, United States of America, South
Korea and Iran. These five countries accounted for more than 43 percent of the
world population in 2019. On the other hand, more than 80 percent of the
global increase in CO2 emissions
was confined to only four countries – China, India, Iran and Indonesia. These
four countries accounted for almost 41 percent of the world population in 2019.
China, the most populous country of the world and accounting for almost 19
percent of the world population in 2019, was responsible for almost 43 per cent
of the global increase in the energy use and more than 60 per cent of the
global increase in the CO2 emissions
during 1990-2019. India, the second most populous country of the world and
accounting for almost 18 percent of the world population in 2019, accounted for
around 11 percent of the increase in world energy use and around 13 per cent of
the global increase in CO2 emissions.
The
decomposition of the inter-country variance in the increase in energy use and CO2 emissions is presented in table 4 (see
appendix). The primary contributor to inter-district variance in the change in
both energy use and CO2 emissions
is found to be inter-country variance in the change in per capita real GDP
followed by the change in the energy intensity of GDP. The inter-country
variance in population change has been found to be responsible for around 20
per cent of the inter-country variance in the change in both energy use and CO2 emissions. A more revealing observation
of table 4 is that inter-country variance in the change in carbon intensity of
energy use is found to be responsible for only around 7 per cent of the
inter-country variance in the change in CO2 emissions.
Population Effects of Energy
Use and CO2 Emissions
Table
5 (see appendix) decomposes the increase in world energy use and CO2 emissions into its different factors in
conjunction with equations (14) and (15). Between 1990 and 2015 total energy
use in the world increased by 5622 Mtoe. Population growth accounted for an
increase of 3933 Mtoe whereas increase in real per capita GDP accounted for an
increase of 6664 Mtoe. However, decrease in energy intensity of GDP resulted in
a decrease of 4975 Mtoe in the world energy use during this period. Similarly,
population growth accounted for an increase of 8962 Mt in CO2 emissions while increase in per capita
real GDP accounted for an increase of 15181 Mt. By comparison, decrease in
energy intensity of GDP resulted in a decrease of 11336 Mt while decrease in
carbon intensity of energy use resulted in a decrease of only 377 Mt during
1990-2019.
The
contribution of the change in different factors to the change in energy use
(appendix table 6) and CO2 emissions
(appendix table 7) has varied widely across 44 countries. Ukraine is the only
country where all factors contributed to the decrease in energy use and CO2 emissions. On the other hand, Brazil is
the only country where all factors contributed to increase in energy use and CO2 emissions. There are 12 countries where
energy intensity of GDP decreased but carbon intensity of energy use increased;
6 countries where energy intensity of GDP increased but carbon intensity of
energy use decreased. This leaves only 24 countries where both energy intensity
of GDP and carbon intensity of energy use decreased during 1990-2019.
An
idea about the effect of population on the environment may be made by relating
the change in energy use attributed to population change to the change in the
energy use attributed to change in energy intensity of GDP. This relationship
may be captured by calculating the population effect coefficient of the change
in energy use (PECE) as
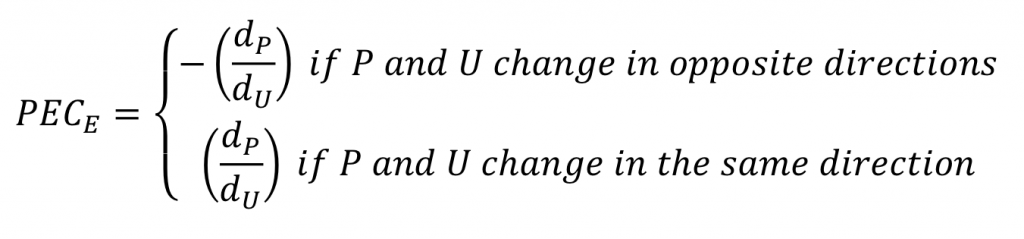
The
PECE reflects the proportion of the decrease
in energy use attributed to the decrease in the energy intensity of GDP which
is offset by the increase in energy use attributed to the increase in
population irrespective of the change in energy use attributed to the change in
per capita real GDP when population increases but the energy intensity of GDP
decreases. Arguing in the same manner, the population effect coefficient of the
change in CO2emissions (PECC) may be defined as
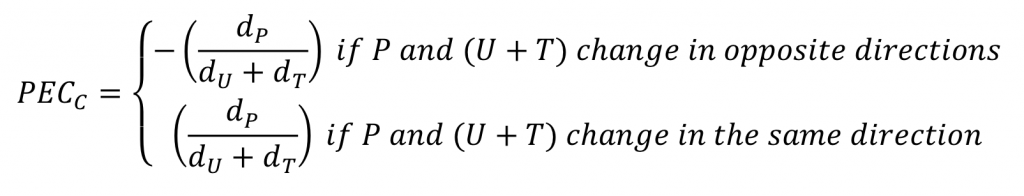
Table
8 (see appendix) gives the population effect coefficient of the change in
energy use and CO2 emissions
for the world and for 44 countries. For the world as a whole, the population
effect coefficient is 0.802 for energy use and 0.771 for CO2 emissions. This means that more than 80
per cent of the decrease in energy use resulting from the reduction in the
energy intensity of GDP has been offset by the increase in population. Similarly,
over 77 per cent of the reduction in CO2 emissions
resulting from the decrease in the energy intensity of GDP and the
decrease in the carbon intensity of energy use has been offset by the increase
in population.
The
population effect coefficient of energy use varies widely across 44 countries.
The energy intensity of GDP decreased in 32 countries between 1990 and 2019 and
the population effect coefficient, in these countries, ranged from just 0.047
in Czech Republic to 5.345 in Malaysia. A population effect coefficient of
0.047 implies that the increase in energy use as a result of the increase in
population offset only 4.7 per cent of the decrease in energy use as a result
of the decrease in energy intensity of GDP. Similarly, a population effect coefficient
of 5.345 implies that that increase in energy use as a result of population
increase is more than five times the decrease in energy use as a result of the
decrease in energy intensity of GDP.
On
the other hand, the energy intensity of GDP increased in eight countries and
the population effect coefficient, in these countries, ranged from 0.677 in
Iran to 24.011 in United Arab Emirates. This means that the increase in energy
use as a result of population growth in Iran was almost 68 per cent of the increase
in energy use as a result of the increase in energy intensity of GDP but 24
times higher in United Arab Emirates. Finally, in four countries, both
population and energy intensity of GDP decreased during 1990-2019. In these
countries, population effects coefficient ranged from 0.002 in Poland to 0.250
in Ukraine which means that the decrease in energy use as a result of decrease
in population is almost negligible compared to the decrease in energy use as a
result of the decrease in the energy intensity of GDP in Poland but 25 per cent
in Ukraine. There is no country where population decreased but energy intensity
of GDP increased during the study period. A similar pattern may also be
observed in the population effect coefficient of CO2 emissions
with the only difference being that the variation of the population effect
coefficient across different groups of countries is even wider.
Discussions and Conclusions
The
present analysis highlights the substantial impact of population growth on the
increase in energy use and CO2 emissions
in the world during 1990-2019. The impact of population growth is further
compounded because of the increase in per capita real GDP which is universally
recognised as one of the key monetary indicators of social and economic
development and of quality of life. The analysis also shows that, at the global
level, the positive environmental effects of the decrease in energy intensity
of GDP and carbon intensity of energy use can offset only a part of the
negative environmental effects of population growth and increase in per capita
real GDP. The positive environmental effect of the decrease in carbon intensity
of energy use has, however, been marginal compared to the positive
environmental effect of the decrease in the energy intensity of GDP.
The
analysis suggests that reducing and ultimately achieving zero population growth
can contribute significantly towards environmental sustainability by
considerably decelerating the increase in energy use and CO2 emissions in the world. However, such an
option does not appear to be strategically viable in the context of United
Nations 2030 Sustainable Development Agenda (United Nations, 2015) which characterises
sustainable development in terms of economic growth, social inclusion and
environmental sustainability. It is well known that population growth is an
important contributor to economic growth (Peterson, 2017; Chaurasia, 2020). In
India, for example, population growth during 2001-2011 accounted for almost 22
percent of the increase in the output of Indian economy (Chaurasia, 2019).
Moreover, a low or zero population growth leads to an ageing population and
insufficient people of productive age to support the economy (Pace, 1971). A
certain minimum threshold of population growth, therefore, is necessary to
lessen the burden of supporting a large number of old people (Peterson, 2017).
At the same time, continued very low population growth for a long period of
time may still lead to substantial increase in population (Piketty, 2014). For
example, population growth at an average annual rate of 0.8 percent during 1700
to 2015 resulted in about 12 times increase in the world population (Maddison,
2001; World Bank, 2017).
Reducing
population growth to very low levels will also have implications for the social
inclusion component of United Nations 2030 Sustainable Development Agenda. The
economic analysis of inequality indicates that lower population growth will
lead to increased global and national income inequality (Peterson, 2017). When
the rate of return to capital is greater than the economic growth rate, the
likely result is the concentration in the ownership of capital leading to
increasing inequality (Piketty, 2014). The future, economic growth is likely to
be slower than the rate of return on capital because the demographic component
of economic growth will grow very little in the coming years (Piketty, 2015).
Obviously, reducing and ultimately achieving zero population growth may not be
a strategically viable option for realising the United Nations 2030 Sustainable
Development Agenda.
The
present analysis highlights the need of integrating population as a factor in
environmental sustainability in the United Nations 2030 Sustainable Development
Agenda. This integration must recognise that extensiveness, intensity and
efficiency of natural resource use interact with each other to determine the
extent of natural resource use and wastes generated. This integration is all
the more important because the three factors of natural resource use are very
much country specific. Unfortunately, the United Nations 2030 Sustainable
Development Agenda pays only lop-sided attention to these interactions which
are the key to sustaining life on the planet Earth.
References
Ang,
B.W., 2004. Decomposition analysis for policymaking in energy: which is the
preferred method? Energy Policy,
32(9), pp.1131–1139.
Ang,
B.W., 2005. The LMDI approach to decomposition analysis: a practical guide. Energy Policy, 33(7), pp.867–871.
Ang,
B.W., 2015. LMDI decomposition approach: a guide for implementation. Energy Policy, 86, pp.233–238.
Ang,
B.W., Liu, F.L., 2001. A new energy decomposition method: perfect in
decomposition and consistent in aggregation. Energy, 26(6), pp.537–548.
Batero,
G., 1589. The reasons of the state. New
Heaven: Yale University Press.
Chaurasia
A.R. [Ranjan, A.], 2009. An empirical analysis of environmental impact of
population affluence and technology. In: S. Somayaji and G. Somayaji, eds.
2009. Environmental concerns and
sustainable development. some perspectives from India. New Delhi: Tata Energy Resources
Institute.
Chaurasia,
A.R., 2017. Decomposition of body mass growth into linear and ponderal growth
in children with application to India. British Journal of Nutrition,
117(3), pp. 113-121.
Chaurasia,
A.R., 2019. Economic growth and population transition in India, 2001-2011. Demography India, 48(1),
pp.1-18.
Chaurasia,
A.R., 2020. Economic growth and population transition in China and India. China Population and Development Studies (Forthcoming).
Chen,
J., Gao, M., Li, D., Song, M., Xie, Q., Jhou, J., 2020. Extended yearly LMDI
approaches: a case study of energy consumption. Mathematical Problems in Engineering.
doi.org/10.1155/2020/9207896.
Chertow,
M., 2001. The IPAT equation and its variants: changing views of technology and
environmental impact. Journal of Industrial Ecology, 4,
pp, 13-29.
Cole,
M., Rayner, A.J., Bates, J.M., 1997. The environmental Kuznets curve: an
empirical analysis. Environment and Development
Economics, 2(4), pp. 401-416.
Cole,
M.A., Neumayer, E., 2004. Examining the impact of demographic factors on air
pollution. Population and Environment, 26,
pp.5-21.
Dietz,
T., Rosa, E.A., 1994. Rethinking the environmental effects of population,
affluence and technology. Human Ecology Review, 1, pp.277-300.
Dietz,
T., Rosa, E.A., York, R., 2007. Driving the human ecological footprint. Frontiers in Ecology and Environment, 5(1), pp.13-18.
Durand,
J.D., 1948. The labor force in United
States: 1890-1960. New York: Social Science Research Council.
Ehrlich,
P.R., 1968. The population bomb. New
York: Ballantine Books.
Enerdata,
2020. Global energy statistical
yearbook. [online] Enerdata SA. Avaliable at: https://yearbook.enerdata.net/ [Accessed 20 September 2020].
Forrester,
J., 1971. World dynamics.
Cambridge: Wright-Allen Press.
Hammond,
G.P., Norman, J.B., 2012 Decomposition analysis of energy-related carbon
emissions from UK manufacturing. Energy,
41(1), pp.220–227.
Horvitz,
C., Schemske, D.W., Caswell, H., 1997. The relative “importance” of
life-history stages to population growth: prospective and retrospective
analyses. In: S. Tuljapurkar and H. Caswell, eds. 1997. Structured-population models in marine, terrestrial, and
freshwater systems. London:
Chapman and Hall. pp.247–271.
Kaya,
Y., 1990. Impact of carbon dioxide emissions control on GNP growth:
interpretation of proposed scenarios. Paper presented to the IPCC Energy and
Industry Subgroup. Paris, Response Strategies Working Group.
Kim,
H.J, Fay, M.P., Feuer, E.J., Midthude, D.N. 2000. Permutation tests for
joinpoint regress with application to cancer rates. Statistics in Medicine, 19, pp. 335-351.
Kim,
Y.J., Strobino, D.M., 1984. Decomposition of the difference between two rates
with hierarchical effects. Demography, 21(3), pp,361-372.
Kopnina,
H., Washington, H., 2016. Discussing why population growth is still ignored or
denied. Chinese Journal of Population,
Resources and Environment, 14(2), pp.133-143.
Kumbaroglu,
G., 2011. A sectoral decomposition analysis of Turkish CO2emissions over 1990–2007. Energy, 36 (5), pp.2419–2433.
Maddison,
A., 2001. The world economy: a millennial
perspective. Paris: Organization for Economic Cooperation and Development.
Malthus,
T.R., 1960 [1798]. On population. New
York: Modern Library.
Meadows,
D.H., Meadows, D.L., Randers, J., Behrens, W.W., 1972. The limits to growth. New York: Universe Books.
National
Cancer Institute, 2013. Joinpoint regression program.
Bethesda, MD: National Institutes of Health, United States Department of Health
and Human Services.
Onanuga,
O.T., 2017. Elasticity of CO2 emissions
with respect to income, population and energy use: time series evidence from
African countries. Economic Alternatives, 4,
pp.651-670.
O’Neill,
B.C., Chen, B.S., 2002. Demographic determinants of household energy use in the
United States. In: W. Lutz, A. Praskavetz, W.C. Sanderson, eds. 2002. Population and environment: methods of analysis. New York: Population Council.
Pace,
J.B., 1971. Some implications of zero population growth. California Medicine, 115(6),
pp.50.
Peterson,
E.W.F., 2017. The role of population in economic growth. Sage Open, October- December 2017, pp.1-15.
Piketty,
T., 2014. Capital in the twenty-first
century. Cambridge, MA: Belknap Press of Harvard University Press.
Piketty,
T., 2015. About capital in the twenty-first century. American Economic Review, 105(5), pp.48-53.
Preston,
S.H., 1994. Population and environment:
from Rio to Cairo. IUSSP distinguished lecture on
population and development. Liege,
Belgium: IUSSP.
Preston,
S.H., Heuveline, P., Guillot, M., 2001. Demography. measuring and modelling population processes.
Oxford: Blackwell Publishers Ltd.
Rees,
M., Osborne, C.P., Woodward, F.I., Hulme, S.P., Turnbull, L.A., Taylor, S.H.,
2010. Partitioning the components of relative growth rate: how important is
plant size variation? The American Naturalist, 176(6).
Rees,
M., Grubb, P.J., Kelly, D., 1996. Quantifying the impact of competition and
spatial heterogeneity on the structure and dynamics of a four-species guild of
winter annuals. American Naturalist, 147(1), pp.1–32.
Shi,
A., 2003. The impact of population pressure on global carbon dioxide emissions,
1975-1996: evidence from global cross-country data. Ecological Economics, 44(1), pp.24-42.
Suri,
V., Chapman, D., 1998. Economic growth, trade and energy: implications for the
environmental Kuznets curve. Ecological Economics, 25,
pp.195-208.
United
Nations, 1973. Population theory. In: United Nations, 1973. The determinants and consequences of
population trends. New York: Department of International Economic and Social
Affairs.
United
Nations, 2000. United nations millennium
declaration. [online] New York: United Nations. Available at: https://www.ohchr.org/EN/ProfessionalInterest/Pages/Millennium.aspx.
[Accessed 4 October 2020].
United
Nations, 2015. Transforming our World: The
2030 agenda for sustainable development. [pdf] New York: United Nations. Available
at: https://sustainabledevelopment.un.org/content/documents/21252030%20Agenda%20for%20Sustainable%20Development%20web.pdf
[Accessed 4 October 2020]
United
Nations, 2019. World population prospects: The
2019 revision, population database. [online] Available at:
http://esa.un.org/unpp/ [Accessed 20 September 2020].
United
Nations Framework Convention for Climate Change, 2009. UNFCCC resource guide
for preparing the national communications of non-annex I parties module 3:
national greenhouse gas inventories. [pdf] Bonn: UNFCCC. Available at: https://unfccc.int/resource/docs/publications/09_resource_guide3.pdf
[Accessed 4 October 2020]
United
Nations Population Fund, 2014. Programme of action of the
international conference on population development. 20th anniversary edition.[pdf]
New York: United Nations Population Fund. Available at:
https://www.unfpa.org/sites/default/files/pub-pdf/programme_of_action_Web%20ENGLISH.pdf
[Accessed 4 October 2020]
Waggoner,
P.E., Ausubel, J.H., 2002. A framework for sustainability sciences: a renovated
IPAT indentity. Proceedings of National Academy
of Sciences, 99(12), pp.7860-7865.
Webber,
H., Sciubba, J.D., 2019. The effect of population growth on the environment.
Evidence from European regions. European Journal of Population, 35(2), pp.379-462.
World
Bank, 2017. World development indicators.
[online] Available at:
https://databank.worldbank.org/source/world-development-indicators
[Accessed 4 October 2020].
York,
R., Rosa, E.A., Dietz, T., 2003. STIRPAT, IPAT and ImPACT: analytical tools for
unpacking the driving forces of environmental impacts. Ecological Economics, 46(3), pp.351-365.
Appendix


