Population projections: recipes for
action, or inaction?
Jane N. O’Sullivan
Dr O’Sullivan is Honorary Senior
Research Fellow at the School of Agriculture and Food Sciences, University of
Queensland.
j.osullivan@uq.edu.au
–––––––––––––––––––––––––––––––––––––––––––
DOI: 10.3197/jps.2016.1.1.45
Licensing: This article is Open Access (CC BY 4.0).
How to Cite:
O’Sullivan, J.N. 2016. 'Population projections: recipes for action, or inaction?'. The Journal of Population and Sustainability 1(1): 45–57.
https://doi.org/10.3197/jps.2016.1.1.45
–––––––––––––––––––––––––––––––––––––––––––
Introduction
Population projections, for the world
or for individual countries, are often cited as context for discussions of the
future. The most commonly cited projections are those of the Population
Division of the United Nations Department of Economic and Social Affairs
(UNDESA) (2016), but some, including the International Panel on Climate Change
(IPCC) socioeconomic pathways, use projections from the International Institute
for Applied Systems Analysis (IIASA) (2007).
From food, water and energy security
to the strength of the workforce, population projections contribute to the
landscape against which various scenarios are played out. Yet oddly, despite
the unreliability of past projections, current projections are usually taken as
immoveable fact in such analyses. The scenarios tested rarely include any
alternative population paths, and even more rarely consider that any policies
or programme options might influence the population path. Where alternative
paths are considered, such as the IPCC scenarios, they are viewed as outcomes
of socioeconomic pathways, not as determinants of those pathways.
An analogy may be the role of day
length in the yield of solar energy. There is an unquestionable link, but
because we can’t alter day length, it is not a variable that is given any
consideration in analysis of renewable energy options. It is there in the
technical calculations, but not in the discussion of determinants or strategic
implications. So it is with population, in most treatment of future challenges
and opportunities.
Cognitive Dissonance: The Fixed Point
That Keeps Moving
Last July, the United Nations
announced their 2015 global population projections to a near-empty room. A few
brief news items dutifully reported that the new estimate for the year 2100 was
11.2 billion people.
Nobody mentioned that this was more
than a billion higher than the UN’s 2010 projection, only five years ago, which
was already a billion higher than its 2004 forecast (Figure 1). Nobody
speculated how much higher it might be revised before we actually get to the
end of the century. Nobody questioned why upward revisions have become a
regular occurrence. Since 2002, each UN projection has been higher than the
last.
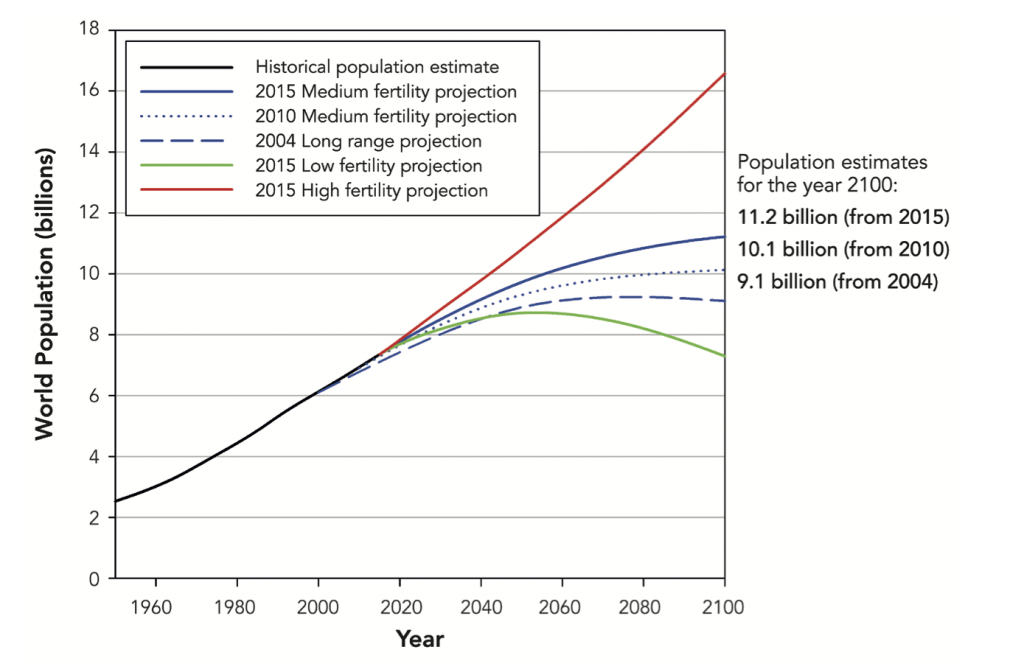
Figure 1. The United Nations population
projections, estimated in the 2010 and 2015 revisions (UNDESA 2011). Prior to
2010, the projections in the UN’s World Population Prospects series only
extended to 2050, but a long-range forecast in 2004 gave estimates to 2300
(UNDESA 2004).
What does this tell us about where
the global population is heading? Over short periods of time, trends are more
visible in the annual change in population, rather than the population itself
(Figure 2). Through the 1990s, the human population increased by a smaller
number each year, building belief that peak population was on the way. But from
2000, the increment started rising again. The UN’s medium fertility projection
expects the downward trend will resume forthwith, but annual tallies of actual
population increase, published in the Population Reference Bureau’s ‘World
Population Data Sheet’ (2015), have recorded increments well above the last
medium projection. The 2015 edition already raises the UN’s new year-2050
number to over 9.8 billion – having increased this estimate each year for quite
some time. Should we now believe they’ve got it right?
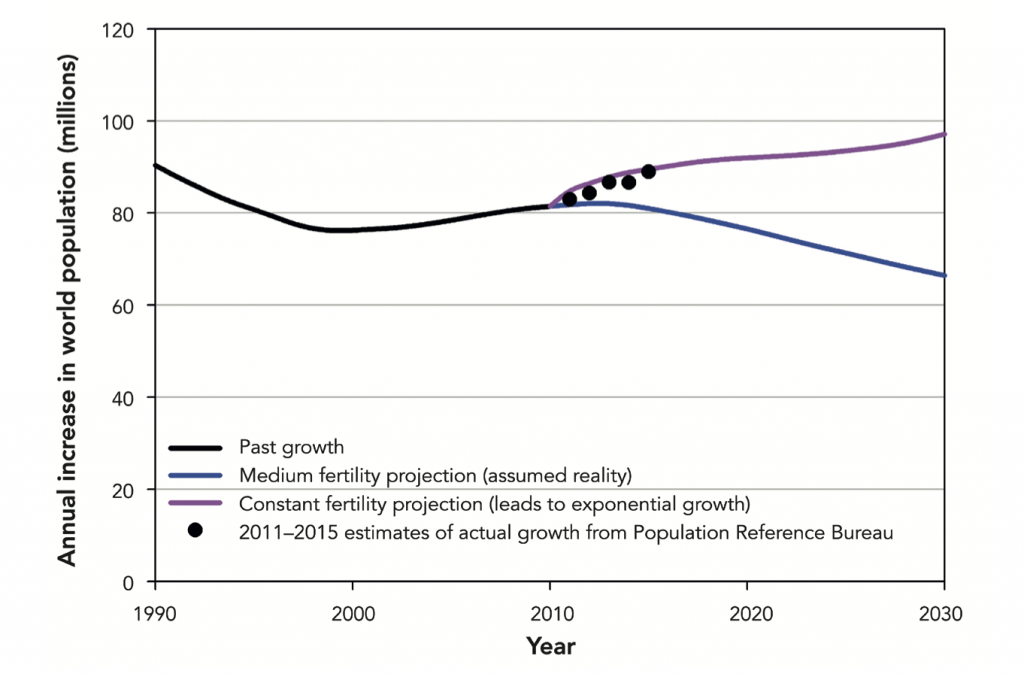
Figure 2. How have we tracked since the
last projection? The annual increment of global population from 1990 to 2010
(black), and those projected in the UN’s 2012 revision of the medium fertility
projection (blue) and the constant fertility projection (pink) (UNDESA 2013).
The latter, in which each country’s fertility is held constant, grows to reach
28 billion in 2100 (unless checked by famine and war). Superimposed are the
estimates of actual increase from the Population Reference Bureau’s annual
World Population Data Sheets, from 2011 to 2015.
Indeed, these annual increments have
been closer to a projection based on no change in national fertility rates.
This ‘constant fertility’ projection would reach 28 billion this century if not
checked by catastrophic mortality.
It is sobering to reflect what such a
check would involve. It would require approximately 100 million extra premature
deaths per year, every year for decades, to bring down the global population
through more deaths rather than fewer births. In contrast, the recent Ebola
epidemic killed around 10 thousand people. The AIDS epidemic has killed around
40 million over 30 years. Since a population of 28 billion is extremely
unlikely to be supported by Earth’s resources, catastrophic mortality is the
path we are currently choosing.
The Projections Don’t Match Reality
The UN’s medium fertility projection
has been based on an assumption that all high fertility countries will progress
steadily to below two children per woman. On release of the 2012 revision,
director of the UN’s Population Division, John Wilmoth, noted that recent falls
had been lower than expected, but the projections continue to be on the same
basis as before. He concluded,
The medium‐variant projection is thus an
expression of what should be possible … [it] could require additional
substantial efforts to make it possible. (emphasis in the original)
(2013 p. 1)
The UN’s projections expect all
countries to follow a similar smooth S-curve shape of fertility transition, if
at different rates (Raftery et al. 2012). The main reason that the projections
keep being revised upward is that a lot of countries are not following this
story-line. Since the mid-1990s, fertility declines in most mid-transition
African and Asian countries slowed or stalled. This has been attributed to a
marked decline in international support for family planning programmes (Sinding
2009). Bongaarts found that “among countries in [fertility] transition, more
than half are in a stall” (2008 p. 109) A number of countries, including
Indonesia, Egypt, Algeria, Kazakhstan, have seen fertility rebound to a higher
level. Several sub-Saharan countries have not really begun to decline. These
realities are not possibilities in the model used for projections.
A few high-fertility countries, like
Rwanda, Ethiopia and Malawi, are now tracking downwards faster than anticipated
by the UN. They may seem unlikely candidates on the basis of the most
often-cited drivers, such as wealth, women’s education and industrialisation.
But in each case, there have been conspicuous recent efforts from both
governments and NGOs to address population pressure through family planning
programmes and women’s empowerment (USAid 2012; PHE Ethiopia Consortium 2016).
Like the family-planning adopting countries of the 1970s and 80s, they are
finding that deliberate interventions to engage communities and increase access
and acceptability of contraception can be highly effective, despite low levels
of wealth and education.
Yet this good-news story is missing
from the UN’s commentary. Instead we are given a fatalistic view. Indeed, the
latest communications from the UN make no reference to ‘additional efforts’. It
presents the medium projection as the most likely “based on an implicit
assumption of a continuation of existing policies” (Gerland et al. 2014 p. 2).
What We Measure Limits What We Do
This fatalism infects most efforts to
anticipate the future. As mentioned above, a wide range of studies use the UN’s
population projections as the multiplier of human demands and impacts, when
testing which policy options might maximise future prospects. By choosing not
to vary population pathways, they provide no advice on the benefit or otherwise
of addressing population growth. Indeed, they rarely discuss population growth
as a factor affecting outcomes.
There are rare exceptions, and their
findings are salient. O’Neill et al. (2010) estimated the difference in
projected greenhouse gas emissions between scenarios assuming UN’s medium
population projection and those assuming the low projection, taking account of
impacts of changing age structure, household size and urbanization. They concluded
that achieving the low population projection could provide 16-29% of the
emissions reductions needed by 2050, and could reduce fossil fuel demand by
37-41% by the end of the century. In a recent study, Bajželj and co-workers
(2014) found that greenhouse gas emissions from the food system were sensitive
to population outcomes by a factor of 1.9, meaning that 10% higher population
would result in 19% more emissions from the food system, assuming the same
wealth and dietary preferences. The World Resources Institute’s exemplary
series “Creating a Sustainable Food Future” (2013) found that achieving
replacement level fertility (around two children per woman) in sub-Saharan
Africa by 2050 would spare an area of forest and savannah larger than Germany
from conversion to cropland, and in doing so save 16 Gt of carbon dioxide
emissions (Searchinger et al. 2013). The Futures Group found that a modest
acceleration in contraceptive uptake in Ethiopia could completely compensate
for the anticipated impacts of climate change on food security in 2050
(Moreland and Smith 2012).
Mathematical Complexity Doesn’t
Necessarily Improve Accuracy Of Projections
The change in rhetoric, which saw the
medium projection shift from ‘what should be possible’ to ‘the most likely’, is
linked to a methodological change. The most recent UN projections adopt a
Bayesian probabilistic methodology. This is a step up from the previous method,
in which high and low fertility projections merely assume a fertility rate 0.5
units (children per woman) higher or lower than the medium course in every
country – greatly underestimating the range of possibilities in high-fertility
countries, and exaggerating them in low-fertility countries.
The new methodology makes more
nuanced assessments of likely variation from the central (“medium”) projection,
but the medium projection itself is determined in much the same way as it was
before. It finds the average course that countries have taken in the past, from
whatever time their fertility started to fall in earnest, and presents this as
the most likely course that each high-fertility country will follow from now
on. The model forces the stereotypical S-shape of fertility transition by
encoding it as a double-logistic mathematical function, and researcher judgements
define the spread of each variable in the function.
Hence it is still a narrow
interpretation of possible futures. The mathematical form cannot accommodate
stalls and reversals in fertility decline, and the researcher assumptions do
not allow for further delays before individual countries establish a downward
trend. Nor does the formula consider as likely, the very high rates of
fertility decline that family planning countries have achieved in the past.
The narrowness can be seen in the
relationship between each country’s total fertility rate (TFR, average number
of live births per woman) and the rate at which it falls (Figure 3). For the
projection (open symbols), the rate of fall is tightly related to the fertility
rate. All remaining high-fertility countries are assumed to start their
fertility decline immediately and in earnest, despite their recalcitrance to
date. Data from the most recent decade (solid symbols) show much wider
diversity, with many countries falling faster, but also many near-stalled in
mid-transition or rebounding before reaching replacement level, and some have
yet to make a start. Data from the 1980s (crosses), when family planning
programmes were widely supported, show many higher rates of transition and few
stalls or rebounds.
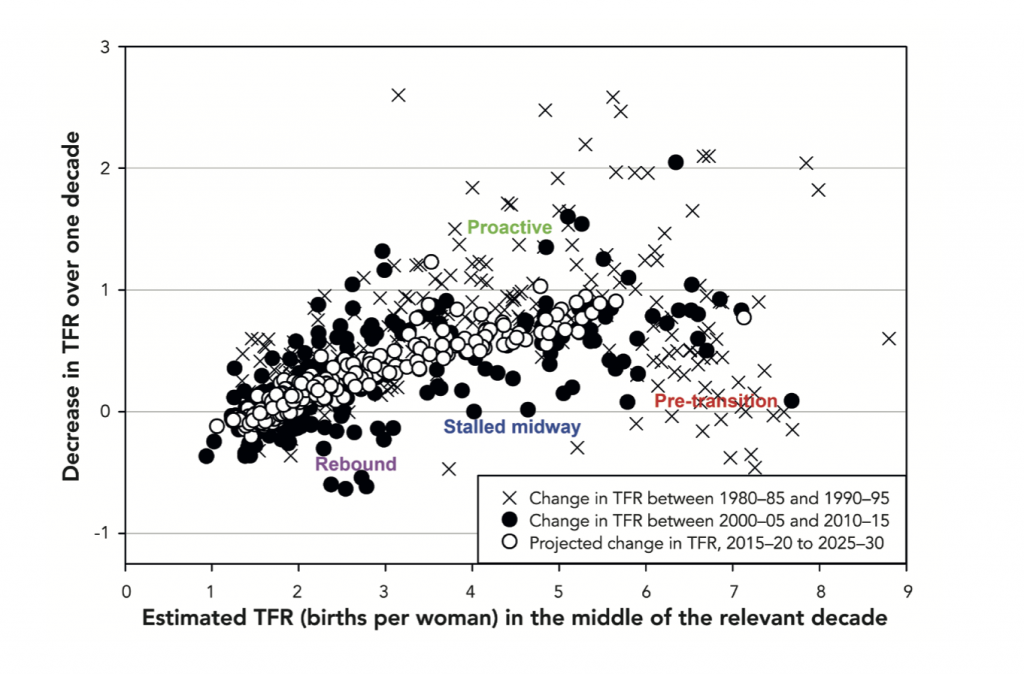
Figure 3. The relationship between the
fertility rate of each country and the rate at which its fertility falls, for
the most recent decade (black dots), compared with the first projected decade
(open dots) and with the 1980s (crosses). Over time, the fertility of
individual countries undergoing fertility transition moves from right to left.
The projections depend on what is anticipated to be the average pathway, the
variation around that average pathway, and when each country embarks on their
transition.
History’s Lessons Unheeded
The UN’s deterministic approach to
projection overlooks the role of choices, rather than chance, in the different
paths each country has followed.
It was programme choice which saw
Thailand’s fertility fall rapidly in the 1970s, Iran’s pull abruptly away from
those of its neighbours, Costa Rica lead the pack in Central America, and
Rwanda now diverging so strongly from neighbouring Burundi and Uganda. These
choices are not being talked up by the UN. Indeed, by presenting the
projections as “probabilistic”, the impression is given that direct action is
futile. There are no policy levers attached to model, determining whether
fertility rate is higher or lower than the average – only unidentified external
factors acting randomly.
For lack of volition, most of the
highest fertility countries do not yet have fertility falls as fast as the
medium projection expects. Why, then, does the medium projection assume that
all remaining high fertility countries will commence steady fertility decline
immediately, when history tells us that these abrupt starts have depended on
policy change? Since these countries have the greatest influence on future
global population, we can only expect that the next revision will also be
upwards.
This is the crux of the matter: assuming a continuation of existing policies, the UN’s
methodology poses that it is most likely that
the highest fertility countries, which have seen the slowest fertility
reductions to date, will show the fastest reductions from now on. Moreover,
despite many mid-transition countries having stalled or increased fertility in
the past decade, it finds that none are likely to do so in the coming decade,
without any change of policy.
I am reminded of the saying, probably
wrongly attributed to Albert Einstein, that “the definition of stupidity is
doing the same thing over and over again and expecting different results.” By
reapplying the same model for each revision, does the UN Population Division
expect its next projection to be any more reliable than the last?
The Future Will Be Shaped By Our
Choices
We could choose a different result,
but it would require doing things differently. Much faster fertility
transitions are possible, if family planning and small family norms are
promoted alongside women’s health and rights. Many developing countries have
successfully achieved below-replacement or near-replacement fertility in this
way. Figure 4 shows the time course of fertility for some of them. In each
case, the abrupt start to fertility decline coincided with initiation of
voluntary family planning programmes. Rates of fertility decline have been two
to three times those expected in the UN projections. No economic or educational
trigger was evident, but in each case economic development, including
improvement in educational and health outcomes, followed as a consequence of
lower population growth (O’Sullivan 2013).
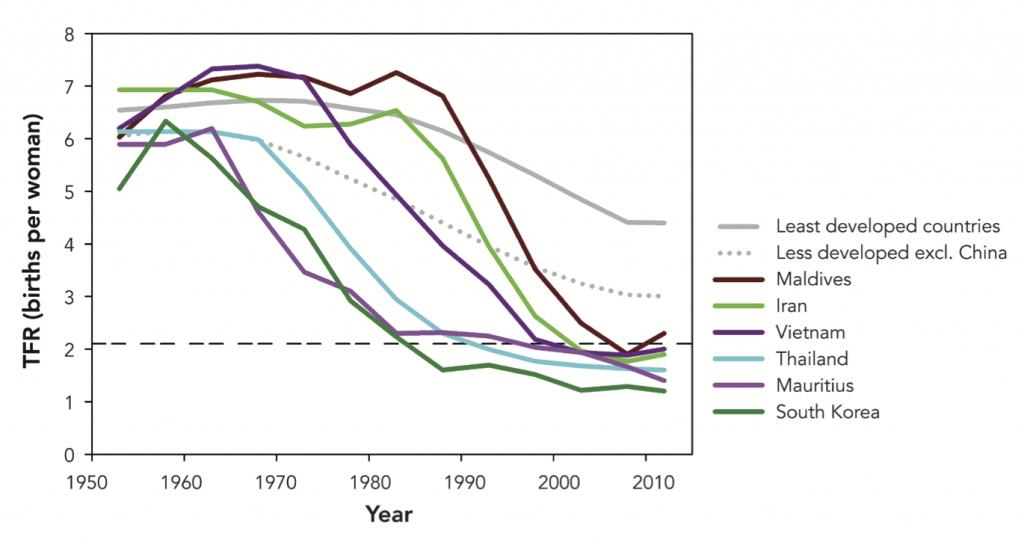
Figure 4. Time course of total
fertility rate (TFR, births per woman) for selected countries which implemented
population-focused voluntary family planning programmes at differing times,
showing rapid change in fertility, compared with aggregate TFR for less
developed and least developed nations. Data from UNDESA (2011) and Population
Reference Bureau World Population Datasheet (2013).
These programmes involved providing
access to family planning information and services to all citizens, through
culturally appropriate channels. They also involved addressing barriers to
women exercising their reproductive choices, such as child marriage, women’s
access to education and economic autonomy, and attitudes of men towards women
and their roles. They did not rely on coercion, such as China’s one-child policy.
Indeed, China’s fertility decline was also driven by a voluntary family
planning programme, which preceded the one-child policy by a decade. By the
time the one-child policy was rolled out in 1979, the job was largely done.
However, over the past two decades concern about coercive fertility control has
been heightened to the extent that merely discussing the benefits of fewer
children is treated as coercive. It is assumed that access alone is sufficient,
and women will make the ‘right’ choice about family size without being given
any information on which to base that choice. Yet the main reasons given by
women for not using contraception are not related to access or affordability
(Ryerson 2010). The successful voluntary family planning programmes of the
1970s and 80s were generally characterised by widespread promotion of fewer,
more widely spaced children, and sound information about contraceptive options,
dispelling myths of their dangers.
Recently, Population Health and
Environment (PHE) programmes, which integrate family planning with livelihood,
public health and environmental management interventions, are showing that
coherent cross-sectoral programmes can greatly increase community acceptance
of, and even enthusiasm for family planning, overcoming cultural resistance
(PAI 2015). New contraception technologies, including implants and injectables,
are making family planning delivery much cheaper, more reliable and less
dependent on medical personnel. New communications technologies and more
literate populations exposed to cultures beyond their own allow information and
attitudinal change to spread more easily. These advances could mean that the
next generation of family planning programmes is even more effective than in
the past. Nor are such interventions costly: a UN study estimated that “for
every dollar spent in family planning, between two and six dollars can be saved
in interventions aimed at achieving other development goals” (UNDESA 2009 p.1).
It’s still possible for the world
population to peak under 10 billion. Each year such action is deferred
increases the achievable peak by around 100 million people. Time is of the
essence, but if political will could be rallied quickly enough, perhaps a peak
around 9 billion could yet be achieved.
Such an outcome would ease many
challenges, particularly food security, climate change mitigation and
adaptation, and biodiversity loss (Speidel et al. 2015). It could head off mass
mortality on a scale humanity has never seen. But first we have to care how
many people there will be.
Conclusion
Projections should arm us to prepare
for the future and take pre-emptive action to avoid threats. Recent population
projections have had the opposite effect. By failing to acknowledge the impact
of choices, they have undermined pre-emptive action. This fatalistic approach
has probably already contributed to a global slow-down in fertility decline
over the past two decades, which has already added billions to the likely peak
population. By giving little weight to the recent slow-down, projections have
recently over-estimated fertility decline. In turn, by presenting overly
optimistic expectations of fertility decline, they have given false reassurance
that population growth will end within decades regardless of what we do, allowing
legitimate concern about overpopulation to be dismissed as naïve and pointless
paranoia. Partly to avoid such condescension, many researchers avoid treating
population as a variable. They consequently fail to measure its profound impact
on so many of the challenges now faced by humanity and by the many other
species we are crowding out. A new narrative is urgently needed, to reinstate
the importance of population policies and programmes for human development and
environmental sustainability (Bongaarts 2016).
References
Bajželj B., Richards K.S., Allwood
J.M., Smith P., Dennis J.S., Curmi E. and Gilligan C.A. (2014) Importance of
food-demand management for climate mitigation. Nature
Climate Change 4, 924–929. http://www.nature.com/nclimate/journal/v4/n10/full/nclimate2353.html
Bongaarts J. (2008) Fertility
Transitions in Developing Countries: Progress or Stagnation? Studies in Family Planning 39(2): 105–110.
IIASA (2007) Population Projections. http://www.iiasa.ac.at/web/home/research/modelsData/PopulationProjections/POP.en.html
Moreland S. and Smith E. (2012) Modeling climate change, food security and population: pilot
testing the model in Ethiopia. Futures Group. http://futuresgroup.com/files/publications/Modeling_Climate_Change_Food_Security_and_Population.pdf
O’Neill BC, Dalton M, Fuchs R, Jiang
L, Pachaui S, Zigova K (2010) Global demographic trends and future carbon
emissions. Proc Natl Acad Sci107:17521-17526.
PAI, Pathfinder International, Sierra
Club (2015) Building resilient communities: the PHE way. http://womenatthecenter.org/wp-content/uploads/2015/07/Building-Resilient-Communities-The-PHE-Way.pdf
PHE Ethiopia Consortium. (2016). What is PHE?. [ONLINE] Available at:http://www.phe-ethiopia.org/.
[Accessed 4 April 2016]
Population Reference Bureau (2015) 2015 World Population Datasheet.http://www.prb.org/Publications/Datasheets/2015/2015-world-population-data-sheet.aspx
Raftery, A.E., N. Li, H. Ševčíková,
P. Gerland, and G.K. Heilig. (2012) “Bayesian probabilistic population
projections for all countries.” Proceedings of the National
Academy of Sciences 109 (35):13915-13921. http://www.pnas.org/content/109/35/13915.full
Ryerson, W.N. (2010) Population, the
multiplier of everything else. In: The Post Carbon Reader:
Managing the 21st Century’s Sustainability Crises, Richard Heinberg
and Daniel Lerch, eds. (Healdsburg, CA: Watershed Media, 2010). http://www.postcarbonreader.com
Searchinger T., Hanson C., Waite R.,
Lipinski B., Leeson G. and Harper S. (2013) Achieving Replacement Level
Fertility. World Resources Institute working paper, Instalment
3 of “Creating a Sustainable Food Future” http://www.wri.org/publication/achieving-replacement-level-fertility
Sinding, S.W. (2009) Population,
poverty and economic development. Phil. Trans. R. Soc. B 364:
3023-3030. http://rstb.royalsocietypublishing.org/content/364/1532/3023
UNDESA (2004) World Population in 2300.http://www.un.org/esa/population/publications/longrange2/2004worldpop2300reportfinalc.pdf
UNDESA (2009) What would it take to accelerate fertility decline in the least developed
countries? UN Population Division Policy Brief No. 2009/1.
UNDESA (2011) World Population Prospects: The 2010 Revision. New
York: United Nations Department of Economic and Social Affairs. http://www.un.org/en/development/desa/publications/world-population-prospects-the-2010-revision.html
UNDESA (2013) World Population Prospects: The 2012 Revision. New
York: United Nations Department of Economic and Social Affairs. http://www.un.org/en/development/desa/publications/world-population-prospects-the-2012-revision.html
UNDESA (2015) World Population Prospects, the 2015 Revision. New
York: United Nations Department of Economic and Social Affairs. http://esa.un.org/unpd/wpp/
Wilmoth, J. (2013) The 2012 Revision. Statement by Director,
Population Division Department of Economic and Social Affairs, United Nations.
Press briefing upon publication of World Population Prospects: Thursday, 13
June 2013, UN Headquarters, New York.